
Authors: Shruthi Narayan, Caryn Hughes and Debbi Poles
Link to PDF chapterGlossary, acknowledgments and reference list
Please access these links for the Glossary for all abbreviations, Acknowledgments and References used.
Key SHOT messages
- Errors continue to account for majority of the reports. In 2025, 3358/4046 (83.0%) of all reports (including near miss (NM) and right blood right patient (RBRP)) were due to avoidable errors.
- There were no confirmed or probable transfusion-transmitted infections reported in 2025.
- The risk of death related to transfusion in the United Kingdom (UK) is 1 in approximately 40,000 components issued, and the risk of serious harm is approximately 1 in 13,500 components issued (includes solvent detergent-treated fresh frozen plasma (SD-FFP) data) based on the reports submitted to SHOT.
- A slight reduction has been noted in the total number of transfusion-related deaths (including all imputabilities) reported to SHOT.
- There was 1 death which was definitely related (imputability 3) to transfusion in 2025 – this was following an acute haemolytic transfusion reaction (HTR).
- Pulmonary complications and transfusion delays were the main causes of reported transfusion-related deaths in 2025.
- Near miss events continue to account for a large proportion, 1370/4046 (33.9%) of the incidents reported to SHOT.
- Inadequate staffing, lack of appropriate training, information technology (IT) issues and suboptimal safety culture continue to be identified as contributory factors to numerous incidents reported to SHOT.
- Trends in pathological transfusion reactions, like the febrile, allergic, hypotensive, and haemolytic reactions are similar to previous years.
- ABO-incompatible (ABOi) transfusions continue to be reported with ineffective pre-transfusion safety checks.
Introduction
The 2025 SHOT data deliver a clear and consistent message: avoidable errors continue to dominate
transfusion‑related incidents, and the trend has not improved. These findings reinforce an urgent truth: transfusion safety cannot improve without decisive, coordinated action across healthcare. The continued frequency of avoidable errors highlights gaps in staffing, staff training, communication, workflow design, digital infrastructure, and safety culture. While the situation has not worsened in 2025, it also has not meaningfully improved across the UK and stability in the face of preventable harm is not acceptable. Variable improvements are in progress in the four UK nations despite ongoing challenges, however this is not consistent, and it remains to be seen if the progress made can be sustained.
SHOT data provide the evidence and the insight. What is needed now is commitment: organisations,
leaders, and clinical and laboratory teams must come together to implement tangible, measurable
improvement actions that address the systemic weaknesses exposed year after year. This chapter sets out the key findings, trends, and learning from 2025, signalling where change is needed most, and where actions can have the greatest impact on keeping patients safe.
The risk of death related to transfusion in the UK is 1 in approximately 40,000 components issued, and the risk of serious harm is approximately 1 in 13,500 components issued based on the reports submitted to SHOT. This includes the risks of harm from errors in the transfusion process. The risk of death is similar to 2024 as, despite a slight reduction, higher numbers of transfusion-related deaths persist in transfusion-associated circulatory overload (TACO) cases and delayed transfusions.
Avoidable errors continue to dominate SHOT reporting, accounting for 3358/4046 (83.0%) of all cases
(Figure 3.1), a proportion that has remained unchanged in recent years. This includes incidents where
no harm occurred, such as near misses and right blood right patient errors, but where the potential for harm was clear.
Figure 3.1: Errors account for most reports in 2025 (n=3358/4046)
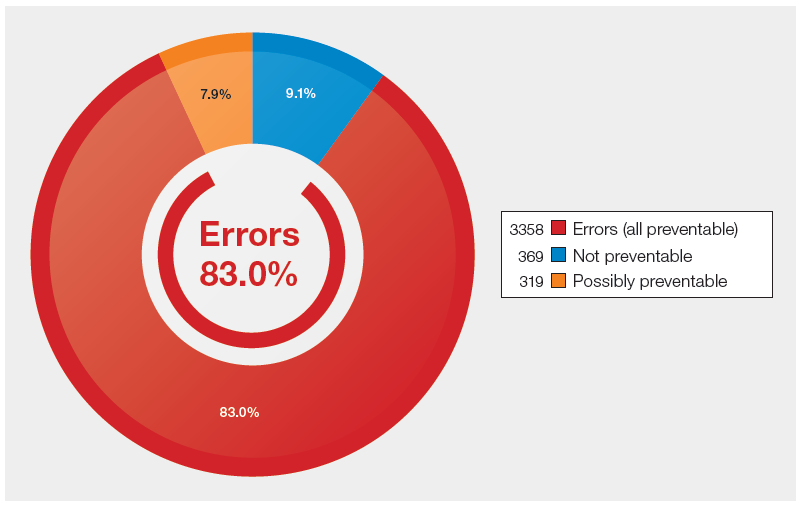
Figure 3.2: No patient-harm and potential patient-harm incidents 2010-2025
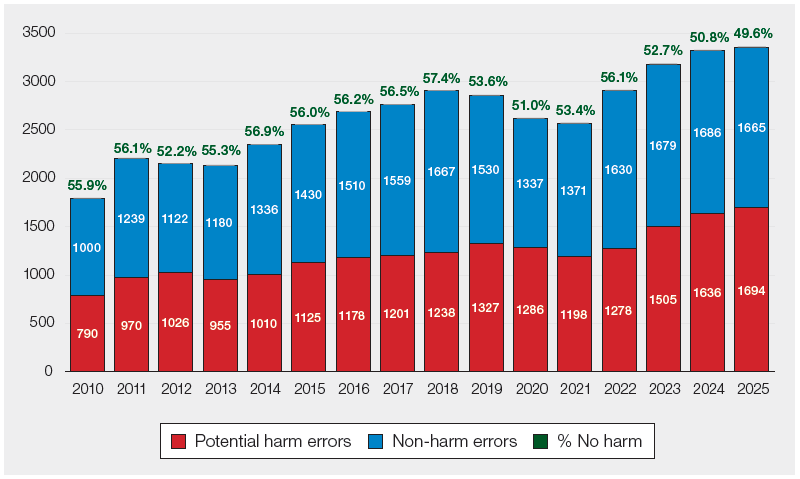
Non-harm incidents include near miss (NM) and right blood right patient (RBRP) errors
Figure 3.2 shows the percentage of no‑harm incidents among the errors reported to SHOT since 2010. In 2025, the proportion of no‑harm incidents has fallen further to 49.6%, the lowest value
recorded since 2010. From a haemovigilance perspective, it is essential not only to maintain strong
levels of incident reporting, but to see a higher proportion of no‑harm events. This would indicate that robust safeguards, effective safety barriers, and proactive risk‑mitigation strategies are functioning as intended. A system in which most reported incidents result in no harm reflects early detection of errors, timely interruption of error chains, and a mature safety culture focused on prevention. However, the current data suggest that we remain far from this ideal state. The decline in no‑harm outcomes highlights persistent weaknesses in system resilience and underscores the urgent need for strengthened processes, improved training, and investment in safety‑critical infrastructure to prevent errors from progressing to cause patient harm.
Deaths related to transfusion n=54
All serious incidents reported to SHOT are assessed for imputability i.e., the relationship of the blood
transfusion to the outcome. The imputability criteria can be found in the SHOT definitions document
(https://www.shotuk.org/reporting/incident/definitions/).
The number of reported deaths assessed as being related to the transfusion has decreased slightly as
compared to 2024: 54 deaths of all grades of imputability reported in 2025 compared to 59 in 2024.
Pulmonary complications and transfusion delays were still the most common causes of transfusion-related deaths reported to SHOT in 2025, accounting for 42/54 (77.8%) of total deaths. In 2025, TACO
(n=24) was responsible for the highest number of deaths in a single category reported to SHOT, followed by delays (n=15).
Key factors identified in transfusion-related deaths are discussed in the relevant chapters of this Annual SHOT Report. Figure 3.3 shows the distribution of deaths related to transfusion reported in 2025 and respective imputability.
Figure 3.3: Deaths related to transfusion with imputability reported in 2025 (n=54)
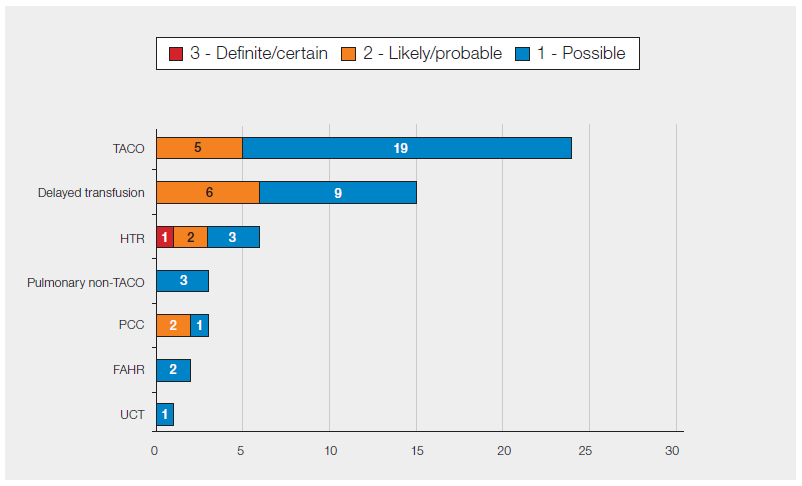
Figure 3.4 presents the deaths reported to SHOT from 2010–2025, categorised according to the degree of imputability assigned. The number of deaths definitely attributable to transfusion (imputability 3) has consistently remained very low in the UK. In 2025, 1 death was classified as having definite imputability. This case involved a haemolytic transfusion reaction in a patient with complex red cell phenotype matching requirements. The case remains under investigation, and learning will be disseminated once the review has been completed.
Despite the reassuringly low number of deaths assessed as definitely linked to transfusion, the overall rising trend in transfusion‑associated deaths in recent years remains a significant concern. While many longstanding challenges within healthcare systems persist, additional pressures have emerged. Increasingly, patients presenting for care have more complex clinical profiles, frequently with multiple co‑morbidities that heighten their vulnerability to adverse outcomes. These complexities are further compounded by ongoing financial constraints that restrict investment in essential safety‑critical resources such as adequate staffing, comprehensive staff training, reliable IT infrastructure, and appropriate healthcare facilities.
Without decisive and coordinated action to address these systemic gaps, opportunities to mitigate preventable risks and optimise transfusion safety may continue to be missed. The high number of deaths, even when many fall into the ‘possible’ rather than ‘definite’ categories, underscores the need for sustained focus on system-wide improvements to support safe and effective transfusion practice.
Figure 3.4: Deaths related to transfusion with imputability reported 2010-2025 (n=433)
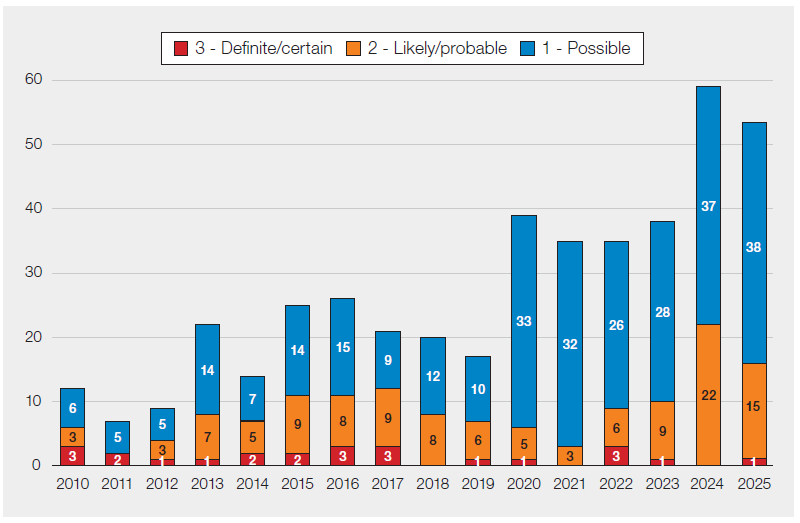
Figure 3.5 presents the trend in transfusion‑related deaths reported to SHOT since 2010, categorised
by reaction or error type. Although the overall number of deaths reported in 2025 is slightly lower than in 2024, offering some cautious optimism that this downward trend may continue, the broader pattern remains concerning. Over the past decade, an upward trajectory has been observed, particularly for deaths associated with transfusion delays and pulmonary complications. The sharp rise in 2024, largely attributable to TACO‑related deaths, is especially notable. While part of this increase may reflect improved reporting and heightened clinical awareness following the national patient safety alert on TACO issued in April 2024 (MHRA, 2024), it may also represent a genuine rise linked to the worsening operational pressures within healthcare services described earlier in the chapter. This persistent pattern is evident despite the implementation of UK‑wide national patient safety alerts aimed at reducing preventable transfusion delays and TACO in recent years (SHOT, 2022; MHRA, 2024).
Figure 3.5: Transfusion-related deaths by SHOT category, 2010 to 2025 (n=433)
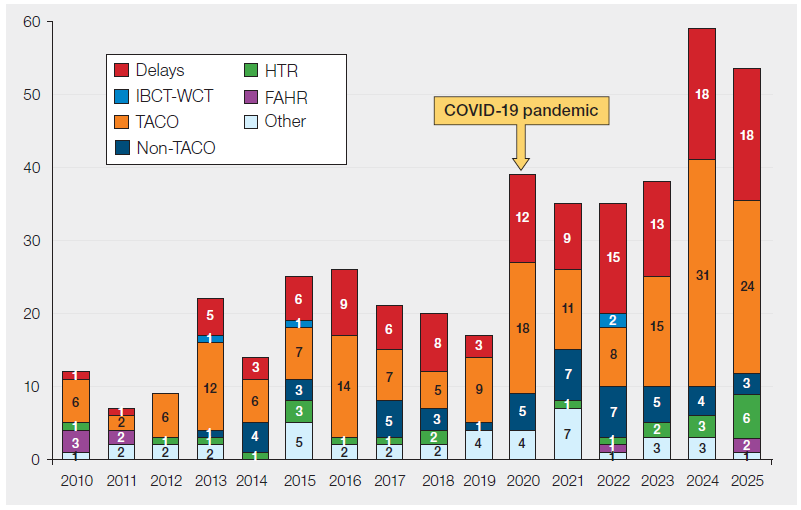
Delays include 1 delay related to PCC in 2019, 2 in 2022, 4 in 2023 and 3 in 2025; ‘Other’ includes 1 each for post-transfusion purpura, transfusion-associated graft-versus-host disease (2012) and anti-D Ig related; there were 11 in the avoidable, over or undertransfusion category, 3 transfusion-transmitted infections, and 24 deaths related to other unclassified reactions
Major morbidity n=160
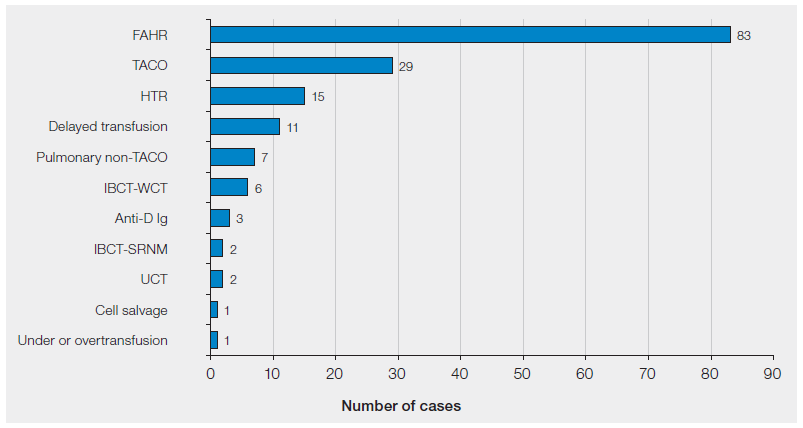
Febrile, allergic, and hypotensive transfusion reactions continue to account for most of the cases with
major morbidity, 83/160 (51.9%), followed by TACO, 29/160 (18.1%), as shown in Figure 3.6. These
are detailed further in the respective chapters in this Annual SHOT Report. Major morbidity criteria are outlined in the SHOT definitions document which is reviewed and updated annually.
Figure 3.6: Ranking of categories to show number of major morbidity in 2025 (n=160)
Review of the SHOT severity grading framework
Work has commenced on a comprehensive review of the current SHOT severity grading framework,
with a particular focus on the classification of major morbidity associated with transfusion reactions
reported to SHOT. This review aims to evaluate the strengths and limitations of the existing grading
criteria, identify practical challenges encountered in their application, and examine alternative grading approaches used within other UK and international reporting systems.
The findings from this evaluation will be used to determine the extent to which the current framework aligns with comparable models and to identify opportunities for refinement. The outcomes of the review will inform a set of recommendations to be presented to the autumn SHOT Steering Group for consideration. Subject to approval, any agreed amendments to the severity grading system will be incorporated into the next definitions document and future Annual SHOT Reports.
Summary data and risks associated with transfusion
Data collected in 2025 are shown in Figure 3.7. Near miss reports continue to be the largest category,
1370/4046 (33.9%), however, this percentage is steadily reducing from 35.2% in 2024, 37.0% in 2023
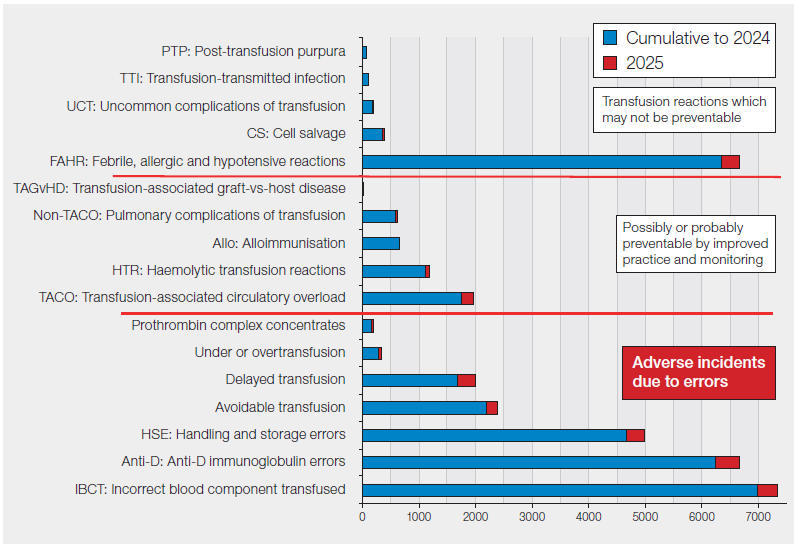
and 39.0% in 2022. Cumulative haemovigilance data from SHOT between 1996-2025 are shown in
Figure 3.8.
Figure 3.7: Summary data for 2025, all categories (includes RBRP and NM) (n=4046)
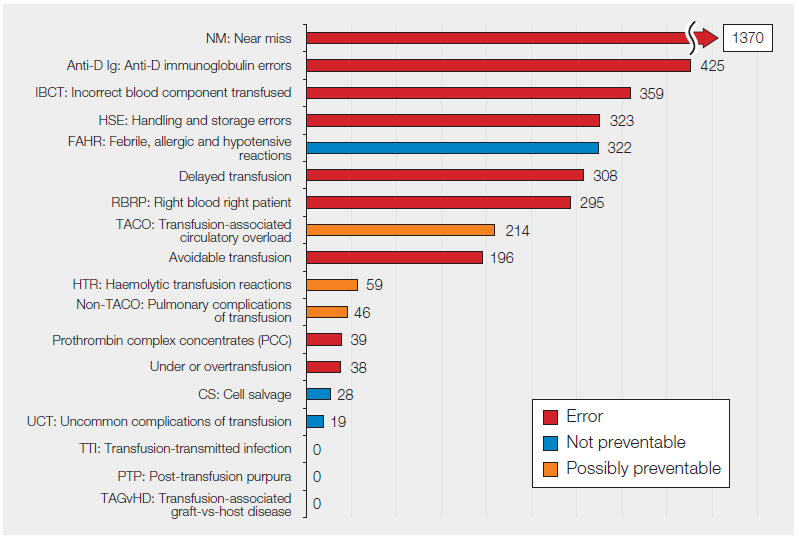
Figure 3.8: Cumulative data for SHOT categories 1996-2025 (n=35724)
ABO-incompatible (ABOi) transfusions n=8
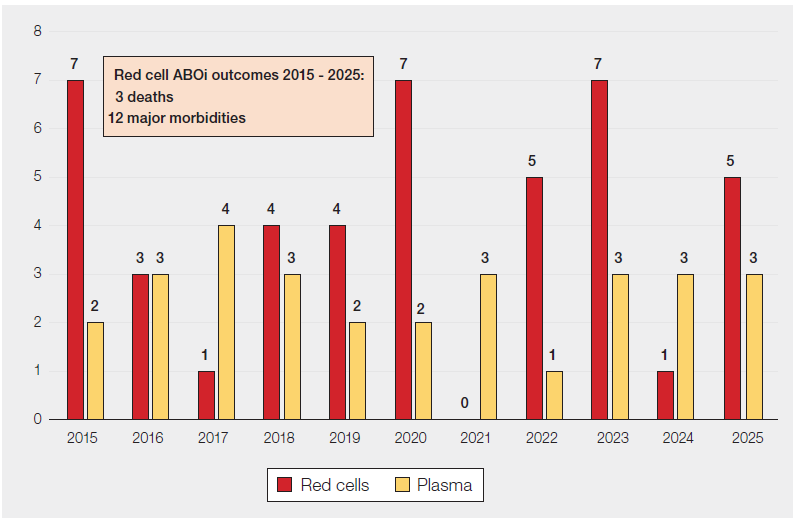
In 2025, there were 5 ABOi red cell transfusions reported and 3 ABOi plasma (2 FFP and 1 SD-FFP)
transfusions. In 3 cases, patients required intensive care or high dependency unit admission and in 1
case, a mild reaction was reported. All patients recovered and there were no deaths reported. All the
red cell transfusions were related to clinical errors, and all plasma transfusions related to errors in the
laboratory. These cases identified weak points in the transfusion process at collection and administration in the clinical area, and component selection in the laboratory.
These cases are explored in more detail in Chapter 10, Incorrect Blood Component Transfused (IBCT)
and Chapter 15, Laboratory Errors.
Figure 3.9 shows the number of ABOi red cell and plasma transfusions reported to SHOT between
2015-2025.

Figure 3.9: Number of ABO-incompatible (ABOi) transfusions 2015-2025
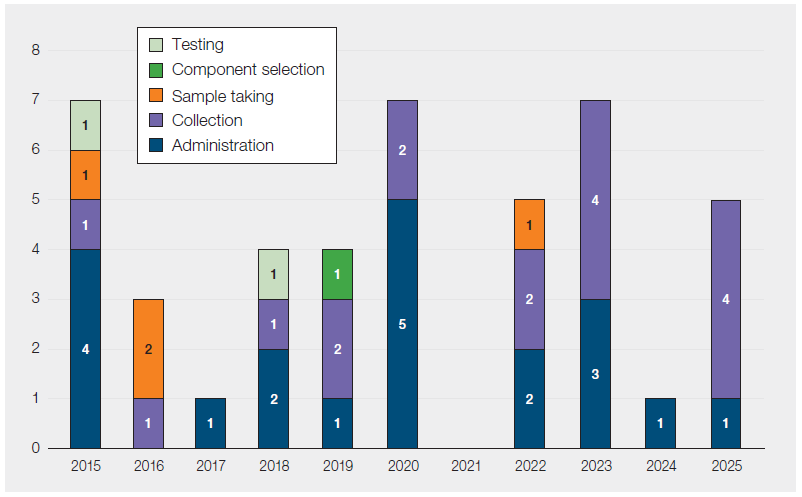
A review of ABOi red cell transfusions between 2015-2025 shows that most were due to clinical errors,
41/44 (93.2%). In these, the primary error was mostly during either collection of the component (n=17) or administration of the component (n=20) due to the suboptimal safety checks at these critical steps (Figure 3.10).
Figure 3.10: ABO-incompatible red cell transfusions by step in the transfusion process 2015-
2025 (n=44)
Current safeguards to prevent ABOi transfusions rely on a mix of IT‑based and human‑dependent
controls. However, preventable errors continue to occur due to staffing pressures, workload–capacity
mismatch, inadequate IT systems, inconsistent training, under‑resourced services, and ineffective learning from previous incidents. The pre‑administration patient side safety check remains the final barrier, but it only protects patients when performed correctly. International data show comparable rates of ABOi transfusion in France (0.19/100,000 units) and the UK (0.28/100,000), which use different safety strategies, whereas Germany shows a higher rate (0.71/100,000) despite similar patient side checks to France (Mirrione‑Savin, et al., 2025). Strengthening safety measures remains essential.
All the ABOi red cell transfusions reported in 2025 were in the non-transplant setting. Transfusion practice in haemopoietic stem cell transplantation is particularly complex, especially in the context of ABO or D mismatch. Compatibility challenges occur across multiple transplant phases, and a patient’s blood group may shift toward the donor type over time. Effective management therefore requires close coordination between transplant teams and transfusion services, with tailored approaches at each stage. Further details are provided in Chapter 28, Transfusion Errors in Transplant Cases.
Data from 2016–2025 show a stark contrast between the actual number of ABOi transfusions and near
misses. In total, 37 actual ABOi red cell transfusions versus 2949 near misses that had the potential to
cause the same catastrophic outcome. The vast majority were wrong blood in tube (WBIT) incidents,
the largest category of near misses reported to SHOT, and explored further in Chapter 16a, Near Miss –
Wrong Blood in Tube (WBIT). Many of these errors would never be detected without a historical laboratory record, underscoring the critical importance of strict group‑check policies (Milkins, et al., 2013).
Every one of these near misses represents a moment when a patient could have been seriously harmed or killed. Most arise from failures in positive patient identification during sample collection and labelling. As the ‘iceberg’ model in Figure 3.11 illustrates, these near misses occur far more frequently than rare, serious adverse events, and provide far more opportunities to learn. When WBIT incidents are not recognised or investigated, the system loses vital learning that could prevent future ABO‑incompatible transfusions.
These data send a clear message: near‑miss analysis is one of the strongest tools we have to strengthen transfusion safety, driving improvements in patient identification, labelling accuracy, and verification processes.
Figure 3.11: ABO-incompatible red cell transfusions 2016-2025: few events (n=37) but many
near misses (n=2949)

Role of checklists in enhancing transfusion safety and optimising their effectiveness
Safety checklists play a critical role in strengthening the transfusion pathway, including pre‑transfusion administration checklists, TACO risk assessment and laboratory exit/component checks (see ‘Recommended resources’). These interventions act as key safeguards to reduce the risk of error at multiple points where systemic or technological controls may not be fully feasible. Their strength lies in simplifying complexity into actionable tasks, supporting memory, and promoting team communication and shared situational awareness.
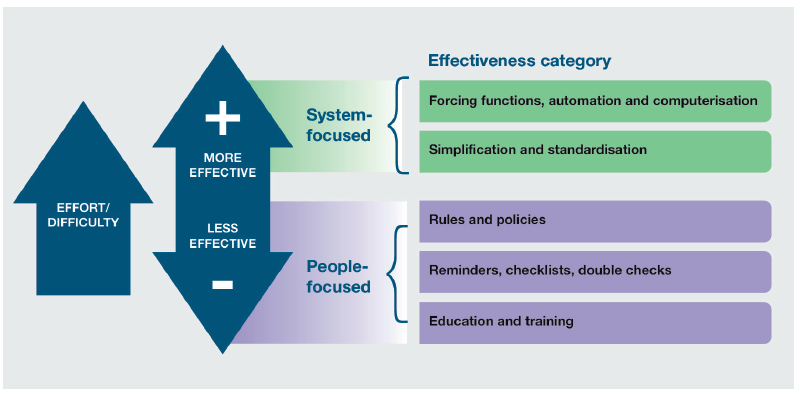
Although checklists are generally less effective than system changes, because they depend on individual actions and can be harder to sustain, they still play a critical role in improving process safety (Figure 3.12). When designed and used appropriately, checklists act as an important safeguard, supporting consistency, reducing reliance on memory, and helping to prevent critical steps from being missed. It is therefore vital to recognise that their effectiveness depends on being performed properly and embedded meaningfully within everyday practice.
Figure 3.12: Hierarchy of interventions and their effectiveness in healthcare
By standardising essential verification steps, such as patient identification, component matching, and communication, checklists provide a reliable safety net within complex, risk-prone processes. However, their effectiveness remains dependent on human performance: staff must carry out checks correctly, consistently, document them accurately and act on the issues or risks identified. This underscores the importance of robust staff training and a clear understanding among staff of why each check matters, reinforcing a culture where safety checks are not seen as administrative tasks but as vital patient‑safety interventions.
There is substantial evidence across healthcare settings that well‑designed checklists can reduce errors and improve process reliability, particularly for complex, high‑risk activities such as surgery using the WHO surgical checklist (WHO, 2009). Checklists are most effective when they prompt critical cognitive steps, standardise practice, and support clear communication between teams, rather than simply acting as documentation tools. Success in using checklists depends on several key factors: strong leadership support, meaningful staff engagement in checklist design, appropriate training, and integration into routine workflow so that checks are performed deliberately and at the correct time. A positive safety culture, where staff feel empowered to pause processes and challenge discrepancies, is essential to ensure genuine adherence rather than superficial completion.
It is important to recognise that checklists are not a standalone solution and have recognised limitations. The success of checklists depends less on their presence and more on how they are used, especially whether they foster meaningful team interaction rather than passive compliance. They cannot compensate for inadequate staffing, poor competence, or dysfunctional systems, and their effectiveness remains dependent on human performance. Over‑reliance, checklist fatigue, or perfunctory ‘tick‑box’ behaviour can weaken their impact if the purpose of each step is not clearly understood (Chance, et al., 2024). Many of these issues are evident from the ABOi transfusions and TACO cases reported where either the checks were done away from the patient side or as a tick box exercise so failed to pick up the issues.
Simply introducing a checklist does not guarantee reliable execution. Work by Catchpole & Russ
(2015) emphasises that their apparent simplicity masks the complexity of real-world healthcare
systems; implementation requires attention to culture, hierarchy, and workflow, not just the tool itself. Acknowledging these limitations, checklists should be viewed as one layer within a wider safety framework, complementing system controls, technology where available, continuous training, and ongoing monitoring to ensure they remain relevant, used as intended, and effective in improving patient safety.
Drawing on human factors and safety science and echoed in works such as The Checklist Manifesto
(Gawande, 2011), the key lesson is that checklists should function as a deliberate safety pause, a moment to align teams, challenge assumptions, and anticipate risk, rather than a procedural formality. Their value emerges when embedded within a broader safety culture that prioritises engagement, psychological safety, and continuous learning.
Conclusion
Haemovigilance data from 2025 continue to highlight persistent, systemic weaknesses in transfusion
safety. While the picture has not worsened further in 2025, the enduring frequency of preventable
transfusion‑related errors and deaths reflects deep‑rooted issues within healthcare. These events are
not isolated, they expose recurring communication gaps, workflow design, procedural reliability, safety culture, and governance. A stable trend is not an acceptable trend. To deliver safe transfusion practice, the healthcare system must act decisively: strengthen the workforce, standardise and embed best practice, invest in digital and technical infrastructure, improve learning systems, and ensure high‑quality training and accountability at every level.

Recommended resources
SHOT Video: Learning from transfusion-related deaths
Cumulative SHOT Data by Category
SHOT Transfusion Safety Standards
Safe transfusion practice: Transfusion checklist
Transfusion-Associated Circulatory Overload (TACO) pre-transfusion risk assessment
PAUSE checklist for the transfusion laboratory